- It makes it harder to promote QlikView in organizations, since readability of QlikView script is no better than of Visual Basic macros in Excel spreadsheets or SQL.
- Since business users usually can't write/read the scripts (they are not supposed to have programming skills), it inflates development and maintenance costs because even minor changes to the logic have to be made by developers and developers have to answer all questions about how this or that is calculated.
- Total lack of metadata lineage. To make it even worse, the dollar-sign expansions make it impossible to parse scripts and rebuild abstract syntax tree in external applications.
I believe that data transformation can be done without programming in the vast majority of cases. That's why I designed EasyMorph that can be integrated with both QlikView and QlikSense.
Today we've published an example of QlikView Integration. It shows how data transformation logic can be moved from a QlikView loading script into an EasyMorph project, where it can be visually designed, modified and viewed. While it doesn't replace the loading script completely (yet) it demonstrates how core transformation logic can be made accessible for non-technical users, who can now explore and modify the logic in a visual way, without dealing with the script syntax.
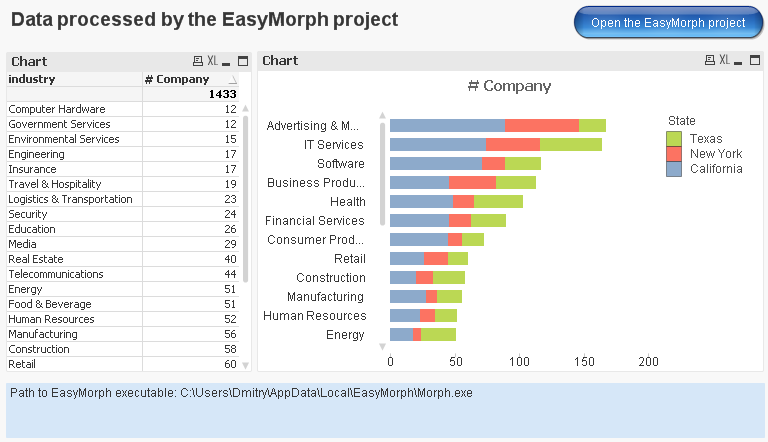
Here is its transformation logic. Input and output transformations are marked on the screenshot.

The logic loads a text file (one file per state), maps state names from another file, does a few calculations and aggregations, and exports the result into a QVD file. Here is the loading script with EasyMorph project integration (comments removed, download the example for the full version):
States:
LOAD * Inline [
State
California
New York
Texas
];
LET pathEasyMorph = GetRegistryString('HKEY_CURRENT_USER\Software\EasyMorph', 'ApplicationPath');
let vCount = NoOfRows('States');
FOR I = 0 to vCount - 1
LET State = Peek('State', I, 'States');
//create input file for the EasyMorph project
EXECUTE cmd /C copy /Y "Inc5000 $(State).csv" input.csv;
EXECUTE $(pathEasyMorph) /c /run "Inc5000 for QlikView.morph";
//read the QVD generated by the EasyMorph project
LOAD
*,
'$(State)' as State
FROM output.qvd (qvd);
NEXT I
Since EasyMorph can't process a list of files yet (this feature will be added in future releases) a simple workaround is used -- a cycle, that iterates through a list of file names, and renaming.
For convenience the EasyMorph project can be opened right from desktop QlikView (in example there is a button for this).
For server execution, you might need to specify the path to EasyMorph executable explicitly, since EasyMorph is installed under a user account and may not be available in the registry under QlikView Server's account.
While it's not shown in the example, you can also add a link to the HTML documentation automatically generated by EasyMorph when it runs a project with /doc parameter from command line (see help on this). In this case users will be able to see the documentation right in the web-browser, next to the application. Or, right in the application, using an extension for web page embedding.
Links:
EasyMorph website
QlikView Integration example
PS. Technical details are copied from EasyMorph Blog.